
NUMBERS
Graphs as a New Way of Thinking
Faced with the need to generate ever-greater insight and end-user value, some of the world’s most innovative companies — Google, Facebook, Twitter, Adobe and American Express among them — have turned to graph technologies to tackle the complexity at the heart of their data.
To understand how graphs address data complexity, we need first to understand the nature of the complexity itself. In practical terms, data gets more complex as it gets bigger, more semi-structured, and more densely connected.
We all know about big data. The volume of net new data being created each year is growing exponentially — a trend that is set to continue for the foreseeable future. But increased volume isn’t the only force we have to contend with today: On top of this staggering growth in the volume of data, we are also seeing an increase in both the amount of semi-structure and the degree of connectedness present in that data.
Semi-Structure
Semi-structured data is messy data: data that doesn’t fit into a uniform, one-size-fits-all, rigid relational schema. It is characterized by the presence of sparse tables and lots of null checking logic — all of it necessary to produce a solution that is fast enough and flexible enough to deal with the vagaries of real world data.
Increased semi-structure, then, is another force with which we have to contend, besides increased data volume. As data volumes grow, we trade insight for uniformity; the more data we gather about a group of entities, the more that data is likely to be semi-structured.
Connectedness
But insight and end-user value do not simply result from ramping up volume and variation in our data. Many of the more important questions we want to ask of our data require us to understand how things are connected. Insight depends on us understanding the relationships between entities — and often, the quality of those relationships.
Here are some examples, taken from different domains, of the kinds of important questions we ask of our data:
- Which friends and colleagues do we have in common?
- What’s the quickest route between two stations on the metro?
- What do you recommend I buy based on my previous purchases?
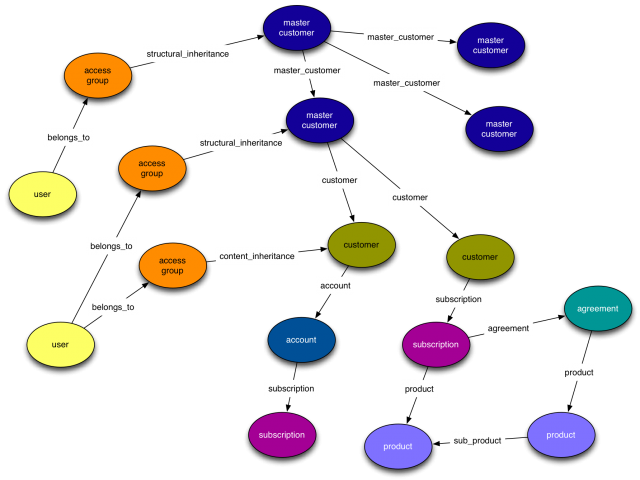
- Which products, services and subscriptions do I have permission to access and modify? Conversely, given this particular subscription, who can modify or cancel it?
- What’s the most efficient means of delivering a parcel from A to B?
- Who has been fraudulently claiming benefits?
- Who owns all the debt? Who is most at risk of poisoning the financial markets?
To answer each of these questions, we need to understand how the entities in our domain are connected. In other words, these are graph problems.
Why are these graph problems? Because graphs are the best abstraction we have for modeling and querying connectedness. Moreover, the malleability of the graph structure makes it ideal for creating high-fidelity representations of a semi-structured domain. Traditionally relegated to the more obscure applications of computer science, graph data models are today proving to be a powerful way of modeling and interrogating a wide range of common use cases. Put simply, graphs are everywhere.
Graph Databases
Today, if you’ve got a graph data problem, you can tackle it using a graph database — an online transactional system that allows you to store, manage and query your data in the form of a graph. A graph database enables you to represent any kind of data in a highly accessible, elegant way using nodes and relationships, both of which may host properties:
- Nodes are containers for properties, which are key-value pairs that capture an entity’s attributes. In a graph model of a domain, nodes tend to be used to represent the things in the domain. The connections between these things are expressed using relationships.
- A relationship has a name and a direction, which together lend semantic clarity and context to the nodes connected by the relationship. Like nodes, relationships can also contain properties: Attaching one or more properties to a relationship allows us to weight that relationship, or describe its quality, or otherwise qualify its applicability for a particular query.
The key thing about such a model is that it makes relations first-class citizens of the data, rather than treating them as metadata. As real data points, they can be queried and understood in their variety, weight and quality: Important capabilities in a world of increasing connectedness.
Graph Databases in Practice
Today, the most innovative organizations are leveraging graph databases as a way to solve the challenges around their connected data. These include major names such as Google, Facebook, Twitter, Adobe and American Express. Graph databases are also being used by organizations in a range of fields including finance, education, web, ISV and telecom and data communications.
The following examples offer use case scenarios of graph databases in practice.
- Adobe Systems currently leverages a graph database to provide social capabilities to its Creative Cloud — a new array of services to media enthusiasts and professionals. A graph offers clear advantages in capturing Adobe’s rich data model fully, while still allowing for high performance queries that range from simple reads to advanced analytics. It also enables Adobe to store large amounts of connected data across three continents, all while maintaining high query performance.
- Europe’s No. 1 professional network, Viadeo, has integrated a graph database to store all of its users and relationships. Viadeo currently has 40 million professionals in its network and requires a solution that is easy to use and capable of handling major expansion. Upon integrating a graph model, Viadeo has accelerated its system performance by more than 200 percent.
- Telenor Group is one of the top ten wireless Telco companies in the world, and uses a graph database to manage its customer organizational structures. The ability to model and query complex data such as customer and account structures with high performance has proven to be critical to Telenor’s ongoing success.
- Deutsche Telekom leverages a graph database for its highly scalable social soccer fan website attracting tens of thousands of visitors during each soccer match, where it provides painless data modeling, seamless data model extendibility, and high performance and reliability.
- Squidoo is the popular social publishing platform where users share their passions. They recently created a product called Postcards, which are single-page, beautifully designed recommendations of books, movies, music albums, quotes and other products and media types. A graph database ensures that users have an awesome experience as it provides a primary data store for the Postcards taxonomy and the recommendation engine for what people should be doing next.
Such examples prove the pervasiveness of connections within data and the power of a graph model to optimally map relationships. A graph database allows you to further query and analyze such connections to provide greater insight and end-user value. In short, graphs are poised to deliver true competitive advantage by offering deeper perspective into data as well as a new framework to power today’s revolutionary applications.
A New Way of Thinking
Graphs are a new way of thinking for explicitly modeling the factors that make today’s big data so complex: Semi-structure and connectedness. As more and more organizations recognize the value of modeling data with a graph, they are turning to the use of graph databases to extend this powerful modeling capability to the storage and querying of complex, densely connected structures. The result is the opening up of new opportunities for generating critical insight and end-user value, which can make all the difference in keeping up with today’s competitive business environment.
Emil is the founder of the Neo4j open source graph database project, which is the most widely deployed graph database in the world. As a life-long compulsive programmer who started his first free software project in 1994, Emil has with horror witnessed his recent degradation into a VC-backed powerpoint engineer. As the CEO of Neo4j’s commercial sponsor Neo Technology, Emil is now mainly focused on spreading the word about the powers of graphs and preaching the demise of tabular solutions everywhere. Emil presents regularly at conferences such as JAOO, JavaOne, QCon and OSCON.


